
If you have opened Task Manager, seen the memory bar pinned near the top, and asked the obvious question: "why is my RAM full when I am barely doing anything?", the honest answer is often that nothing is wrong. Windows and macOS both fill memory on purpose, and a high number can mean the system is doing its job rather than failing at it. I went through Microsoft's and Apple's own documentation to separate the memory that is working for you from the memory that is actually costing you speed.
In a Hurry? Start Here
- A full memory bar is usually Windows caching on purpose, and cached pages count as available, not used. Why full RAM is usually fine
- Take two readings, one after a clean boot and one during the slowdown. The app that grew is the culprit. How to read Task Manager
- Six categories account for almost every case: SysMain, the search indexer, browsers, browser-engine apps, sync clients and scheduled scans. The six real culprits
- Turn on the browser's own Memory Saver and stop installing tab-suspender extensions. Chrome and Edge both ship it now. The browser fix
- Only buy more RAM if committed memory stays above physical memory while you work. When more RAM is the answer
Table of Contents
Disclosure: TechDeskZone is reader-supported. When you buy through links on our site, we may earn an affiliate commission at no additional cost to you. See our affiliate disclosure for details.
Why Full RAM Is Usually Not the Problem
Microsoft’s own performance documentation says it plainly: by default, Windows caches file data that is read from disks and written to disks, and those cached pages stay on the standby list, where they count as available memory rather than used memory (Microsoft Learn, Performance Tuning Cache and Memory Manager). The cache exists because reading from RAM is far cheaper than reading from a drive.
That has a practical consequence. The Cached figure in Task Manager can climb into several gigabytes without anything being wrong, and it shrinks the moment an app needs the space. Windows gives those pages back first, before it does anything dramatic. A machine that has been running for a week with a full bar is often just a machine with a warm cache.
The In use figure is a different pool. It covers the working sets of your running apps, plus kernel and driver memory, plus whatever Windows has compressed. Windows stores some inactive pages compressed in RAM instead of writing them out to the page file, and Task Manager labels this next to the In use number. Compression is why an 8 GB machine can carry more than 8 GB of application state without collapsing.
A Mac behaves the same way under different labels. Activity Monitor reports Cached Files, which Apple describes as files cached into unused memory to improve performance, kept until the memory is overwritten (Apple Support, View memory usage in Activity Monitor). Apple also publishes a Memory Pressure graph built from free memory, swap rate, wired memory and cached files. That graph is a far better signal than the percentage in the sidebar.
So ignore the percentage for a moment and ask a different question: is the machine waiting on storage? If it is, you will feel it as a pause when you switch apps. That pause tells you far more than the coloured bar does. If you want the underlying vocabulary, our guide to computer hardware basics covers what RAM actually does while the machine is running.
Read Task Manager Without Guessing
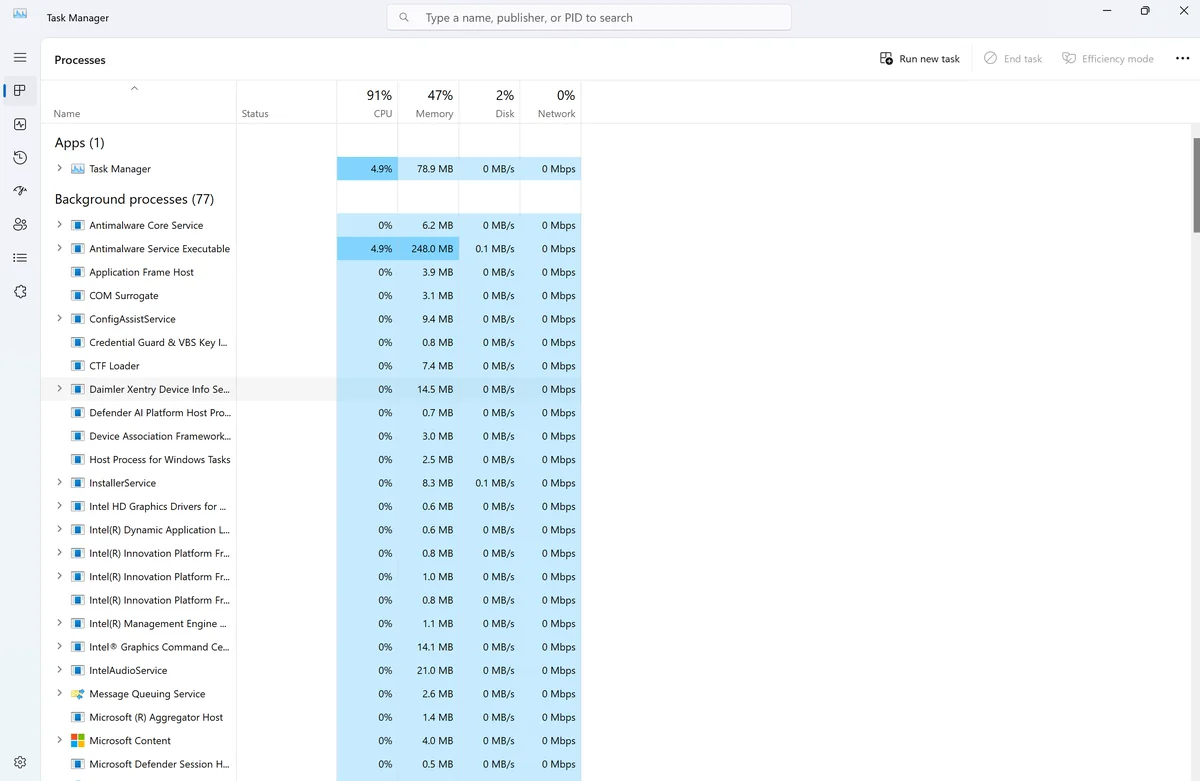
Every diagnosis starts in the same place. Press Ctrl + Shift + Esc on Windows, or right-click the taskbar and choose Task Manager. On macOS, open Activity Monitor and click the Memory tab. Spend two minutes here before changing any setting, because the rest of this article only makes sense against a real reading from your own machine.
Which column you are actually looking at
The Processes tab shows a Memory number per app, and that number is the private working set: memory the process has to itself, not shared with anything else. The Details tab shows a Working Set column, which is larger because it also counts memory the process shares with other processes. Neither is wrong. They answer different questions.
For finding a memory hog, the Processes tab is the right one, because it aggregates the children. Chrome will not appear as one entry. It appears as a group you can expand into a dozen or more processes, and the parent figure is the one worth reading.
Committed versus physical
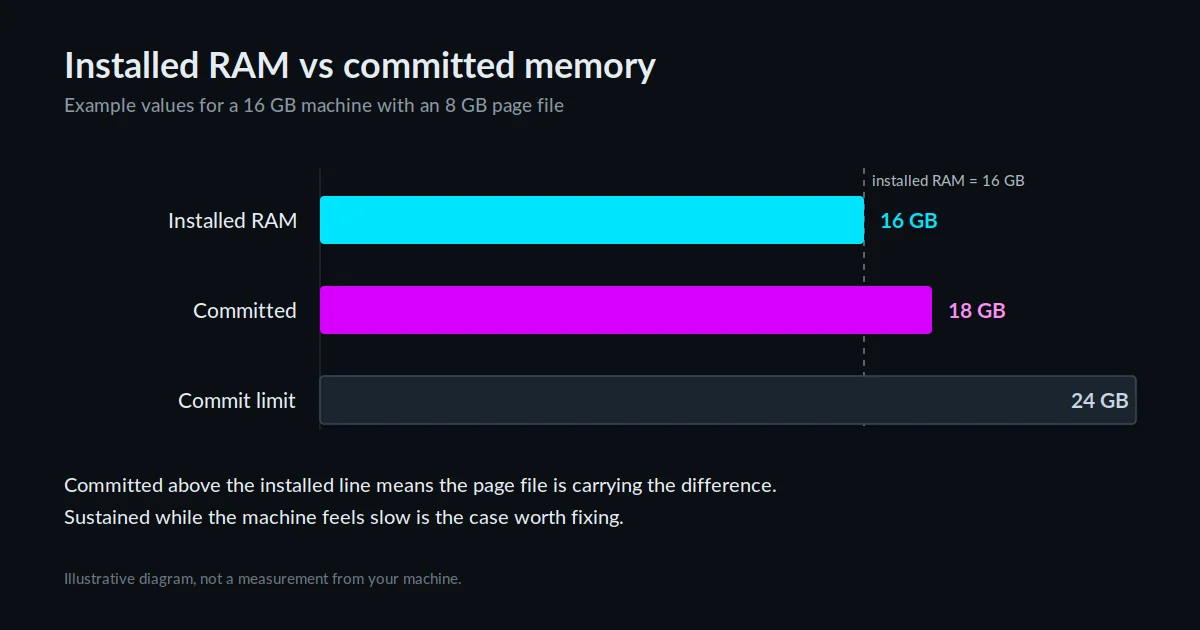
The Performance tab is where the useful comparison lives. Committed memory is the total that has been promised to everything running, and it can exceed your installed RAM because the page file backs the difference. When committed sits above physical memory for long stretches while the machine is slow, you are swapping. That is the case worth fixing.
Take two readings, not one
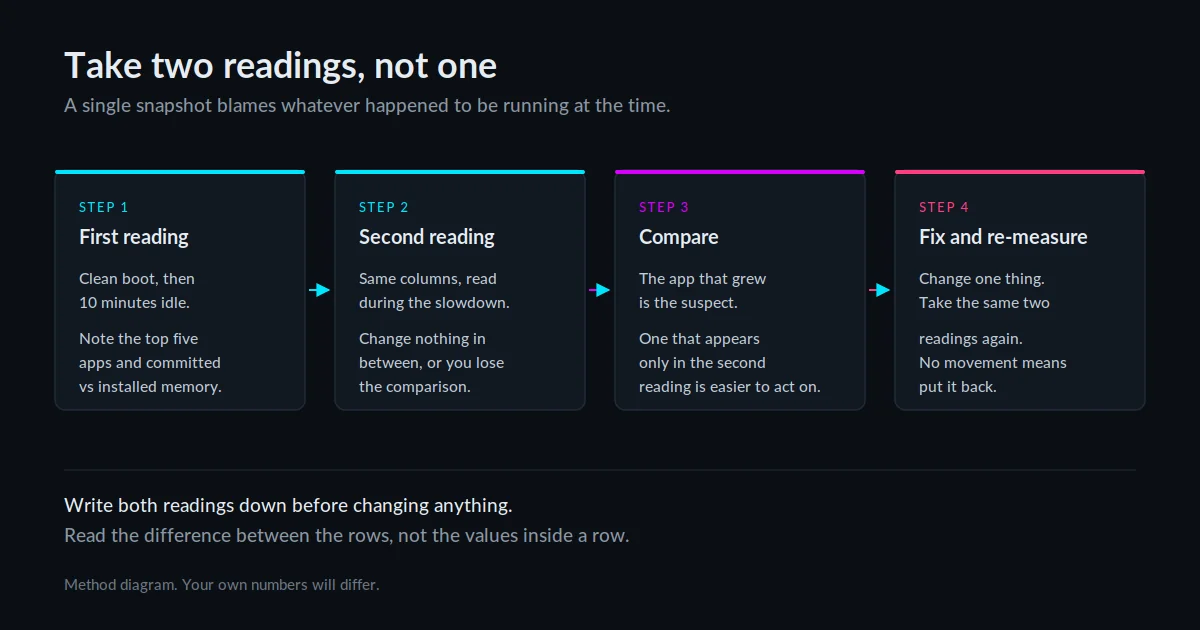
Sample the machine twice. First, ten minutes after a clean boot with nothing open, and note the top five entries. Then sample again during the slowdown, and compare. The app that grew between the two readings is your suspect. A single snapshot taken during a slowdown will blame whatever happened to be running, which is how people end up disabling a service that was never the problem.
Write both readings down before you change anything. Four columns are enough:
| Reading | Top five apps by memory | Committed vs installed | Feels slow? |
|---|---|---|---|
| Clean boot, 10 minutes idle | |||
| During the slowdown | |||
| After the fix |
A filled-in pair looks like this. The numbers below are illustrative, laid out for a 16 GB laptop:
| Reading | Top five apps by memory | Committed vs installed | Feels slow? |
|---|---|---|---|
| Clean boot, 10 minutes idle | Browser 1.9 GB, antivirus 420 MB, cloud sync 310 MB, phone link 190 MB, shell 150 MB | 7.8 GB committed, 15.4 GB installed | No |
| During the slowdown | Browser 3.8 GB, chat app 1.4 GB, antivirus 410 MB, cloud sync 330 MB, shell 150 MB | 14.2 GB committed, 15.4 GB installed | Yes |
Two apps grew between the readings. The browser added 1.9 GB and the chat app added 1.4 GB, while committed memory climbed 6.4 GB. The two visible additions do not account for the whole rise, and that leftover is the part worth chasing, because it belongs to a service, a driver or a background process the Processes tab did not put in front of you. Close the two apps, take the same two readings again, and watch which number moves.
Read the difference between rows, not the values inside a row. An app that appears in both readings and grew is your culprit. An app that appears only in the slow reading is your culprit as well, and that one is easier to act on because you can close it.
The Six Things That Actually Eat Memory
Once you have your list, it usually resolves to one of six categories. They behave differently, and they need different fixes. Treating them as one lump is why the generic advice fails. If the distinction between an app, a service and a background process is not one you have ever needed before, our plain-English guide to what software actually is covers the groundwork.
1. SysMain, formerly Superfetch
SysMain is the Windows service that analyses how you work and preloads apps it expects you to open. Windows runs it on purpose, and on a healthy machine it makes things start faster. It becomes visible when it misbehaves, and Microsoft documents exactly that failure: SuperFetch scanning the VAD tree of a running process can spin on a large tree and spike CPU (Microsoft Learn, SuperFetch (SysMain) service consumes CPU).
If SysMain climbs while the machine is otherwise idle, and the same spike returns every time you open a large app, that matches the documented fault and you can act on it. If it sits low while your machine behaves, leave it alone. Disabling SysMain wholesale is the single most repeated bad tip in this corner of the internet, and on a machine with a spinning disk it can make the first launch of every app slower.
2. The Windows Search indexer
The indexer walks your files so that search returns results quickly, and it runs hardest right after you dump ten thousand photos onto the drive. Microsoft’s own instructions live under Settings, then Privacy and security, then Search, where you can see which folders are indexed and narrow the list (Microsoft Support, Search indexing in Windows). Narrowing it to the folders you actually search is a real fix, and it costs you nothing on the folders you never search anyway.
3. Browsers, by design
Browsers are multi-process on purpose. The model was chosen so that one bad page cannot take down the whole app, and Electron inherited it unchanged: each tab renders in its own process, with a single browser process controlling them (Electron, Process Model). That architecture buys stability and spends memory to get it. It is not a leak.
Chrome now ships the fix natively. Under Settings, then Performance, Memory Saver deactivates tabs you are not using, and Chrome reloads them when you return. There are three levels: Moderate, Balanced and Maximum, and the difference is how long a tab has to sit idle before it is deactivated. Chrome also names the things that block deactivation, including audio or video playing, screen sharing, active downloads, partially filled forms, pinned tabs and connected USB or Bluetooth devices (Google, Personalize Chrome performance).
That list explains most “Memory Saver does not work” complaints. A tab playing music will never be deactivated, so a dozen tabs with audio streams open will hold their memory no matter which level you pick.
4. Desktop apps built on a browser engine
Slack, Discord, Teams and a long list of others are Electron apps or close relatives. Each window is a renderer process, and each one carries the cost of a browser engine. The visible symptom is a single chat app showing up with six processes and a bigger memory footprint than you expected for a text window. That is the architecture working as designed.
You cannot fix this in settings. You can limit how many of these you keep running, and you can stop them launching at boot. Both are covered below.
5. Sync clients
OneDrive, Dropbox and Google Drive all keep a database of what is where, and all of them run background work to reconcile it. On a large folder tree that bookkeeping is not free. If your memory climbs steadily while a sync client runs and settles when you pause it, you have found your answer. The fix is usually scope: sync the folders you need rather than the whole drive.
6. Scheduled scans and updates
Antivirus scans, Windows Update delivery work and driver updaters all run on schedules you did not set. They tend to fire in the background when the machine is idle, which is exactly when you notice your fans spin up. Check the schedule before you assume an app has gone rogue.
Fixes That Hold
These are ordered by how much they give back for how little they risk. The first three are reversible in under a minute, which matters, because a fix you cannot undo is how machines end up in worse shape than they started.
If you want the whole path in one place before the detail, it comes down to four fixes. Each one lists what it costs you, because the cost is the part people skip when they copy a fix list off a forum.
- Stop apps launching at boot. The biggest and safest win. Cost: those apps stop starting themselves, so you open them when you need them. Nothing is deleted, and the switch goes back.
- Put Efficiency Mode on the apps you keep open but are not looking at. Cost: the process runs at low priority, so the app feels heavier when you do switch to it. Do not apply it to the program you are working in.
- Cap background activity, one app at a time. Cost: set to Never, the app gives no notifications and takes no background updates while it is closed.
- Let the browser manage its own tabs. Cost: a tab you have not touched for a while may reload when you come back to it.
Then leave the cleaners alone. A memory cleaner hands back a cache Windows was using to make your apps fast, and the system rebuilds it straight away, so you pay twice and gain nothing. The leave-alone list covers the rest of that category.
Stop apps launching at boot
On Windows 11, go to Settings, then Apps, then Startup, and switch off anything you do not want at login. Task Manager also carries a Startup apps tab with an impact rating per entry. Disable first, uninstall later, and only after a week of not missing the app. Disabling is reversible, and it does not delete anything.
On macOS the equivalent is System Settings, then General, then Login Items. Remove the entry rather than hiding it, and check the “Allow in the Background” list underneath, which is where modern Mac apps hide.
Put known offenders in Efficiency Mode
Efficiency Mode is a Windows 11 feature that does two specific things: it reduces the process base priority to low and sets the quality-of-service mode to EcoQoS (Microsoft DevBlogs, Reduce Process Interference with Task Manager Efficiency Mode). It does not cap memory. It tells the scheduler to favour everything else.
That makes it right for a chat app you keep open but are not looking at, and wrong for the app you are actively working in. Applying it to the wrong process is a common way to make a machine feel slower while the memory bar improves.
Cap background activity per app
Windows 11 exposes a per-app control under Settings, then System, then Power and battery, then Battery usage, then the app, then Manage background activity. The three options are Always, Power optimized and Never. Power optimized lets Windows decide, and it may throttle an app that uses more power than it should (Microsoft Support, Manage background activity for apps in Windows).
Never means no notifications and no background updates, so set it deliberately for apps you open yourself. This setting is the cleanest way to stop a sync or messaging client from working while you are not there.
Let the browser manage its own tabs
Turn Memory Saver on and pick Balanced. Install no extension to do this job. A tab suspender extension adds its own footprint and its own permissions to solve a problem Chrome already solves, and it will not override the blockers listed in Chrome’s own documentation. If you use Edge, the equivalent is Sleeping Tabs.
What to leave alone
Do not run a memory cleaner. These tools force cached pages out of RAM, which hands Windows back a cache it was using to make your apps fast, and the system rebuilds it immediately. You pay the cost twice and gain nothing. For the same reason, avoid registry cleaners and any tool that advertises “more free RAM” as an outcome.
When the Answer Is More RAM
Software changes only go so far, and there is a point where the honest answer is a bigger stick. The test is not the percentage. It is whether your machine spends real time paging while you work: committed memory above physical memory, swap used climbing on a Mac, memory pressure sitting in yellow or red rather than green.
If that is your situation and you are already running 8 GB with a browser habit, more memory will do more for you than any setting on this page. I would rather tell you that than sell you a tweak that does not work. If the whole machine is older than the software you now need it to run, the arithmetic sometimes points at a replacement instead of an upgrade, which is what our guide to what $400 buys in a laptop is for.
How I Checked This
I have not run any benchmarks for this page, and I am not going to pretend otherwise. The behaviour claims come from vendor documentation published by Microsoft, Apple and Google, each linked at the point it is used, and each retrievable from the Sources list below. The menu paths are the current ones for Windows 11 and macOS 15 Sequoia. On Windows 10 most of these controls still exist but sit elsewhere: startup apps live under Settings, then Apps, then Startup. The per-app background activity control from the fixes section is Windows 11 only. macOS 12 Monterey and earlier used System Preferences rather than System Settings, so match the setting name rather than the path.
What I have not done is measure memory on your machine. That is not a gap I can close from here, which is why every diagnostic step above is written so that you can run it yourself and read a number off your own screen. If an app of yours does not match a pattern here, take the two readings and trust what you see over any list.
Q&A
Is high RAM usage bad?
Not by itself. Windows and macOS both cache data in otherwise idle memory, and cached pages are handed back the moment an app needs them. The signal to act on is your machine waiting on storage, seen as sustained paging, rising swap, or memory pressure outside green.
Should I disable SysMain?
Only if it matches the documented fault, which is sustained high CPU rather than a high memory reading. Microsoft’s own troubleshooting article covers that specific case. On a healthy machine SysMain makes launches faster, and disabling it by default trades a real benefit for a problem you do not have.
Why does Chrome use so much memory?
Because each tab runs in its own process, a design choice that stops one bad page from taking down the browser. Chrome’s Memory Saver deactivates idle tabs to claw the memory back, but it will not deactivate tabs playing audio, screen sharing, downloading, holding a filled form, pinned, or connected to a device.
How do I know if I need more RAM?
Compare committed memory against installed memory while you work, not while the machine idles. If committed stays above physical memory and the machine feels slow at the same time, more RAM will help. If committed stays below it, the bottleneck is somewhere else.
What to Do Next
Start with the two readings, not with a setting. Ten minutes after a clean boot, then again during the slowdown. The gap between them names your culprit, and everything after that is a choice about that one thing rather than a general tidy-up of the machine.
Then work down the fixes in order, keeping a note of what you changed and checking the same two readings after each one. Every item on the list is reversible, and if a change does not move the numbers, put it back. If the machine still feels slow once the numbers have settled, the bottleneck sits somewhere other than memory, and those two readings are what tell you where.
Sources
Microsoft Learn, Performance Tuning Cache and Memory Manager, retrieved 2026-10-27, https://learn.microsoft.com/en-us/windows-server/administration/performance-tuning/subsystem/cache-memory-management/
Microsoft Learn, SuperFetch (SysMain) service consumes CPU, retrieved 2026-10-27, https://learn.microsoft.com/en-us/troubleshoot/windows-client/performance/superfetch-sysmain-service-spikes-cpu
Microsoft Support, Manage background activity for apps in Windows, retrieved 2026-10-27, https://support.microsoft.com/en-us/windows/experience/performance-optimization/manage-background-activity-for-apps-in-windows
Microsoft Support, Search indexing in Windows, retrieved 2026-10-27, https://support.microsoft.com/en-us/windows/experience/performance-optimization/search-indexing-in-windows
Microsoft DevBlogs, Reduce Process Interference with Task Manager Efficiency Mode, retrieved 2026-10-27, https://devblogs.microsoft.com/performance-diagnostics/reduce-process-interference-with-task-manager-efficiency-mode/
Apple Support, View memory usage in Activity Monitor on Mac, retrieved 2026-10-27, https://support.apple.com/guide/activity-monitor/view-memory-usage-actmntr1004/mac
Google, Personalize Chrome performance, retrieved 2026-10-27, https://support.google.com/chrome/answer/12929150
Electron, Process Model, retrieved 2026-10-27, https://www.electronjs.org/docs/latest/tutorial/process-model
The Verdict
Most full memory bars are not a fault. Windows caches file data by default and hands those pages back the moment an app needs them, which is why a machine that has been running for a week looks worse than one that just booted.
What helps is measuring before you change anything. Sample Task Manager twice, once clean and once slow, and the app that grew between the two readings is the one worth acting on. In practice that app is nearly always a browser, a browser-engine chat client, a sync client, or a scheduled scan.
Two pieces of advice to ignore: do not run a memory cleaner, because forcing cached pages out of RAM costs you the cache and gains nothing, and do not disable SysMain unless it matches Microsoft's documented high-CPU fault. If committed memory stays above installed memory while you work, none of this will save you and the honest answer is more RAM.
← Back to Guides Hub